Ecological data / Environmental perception
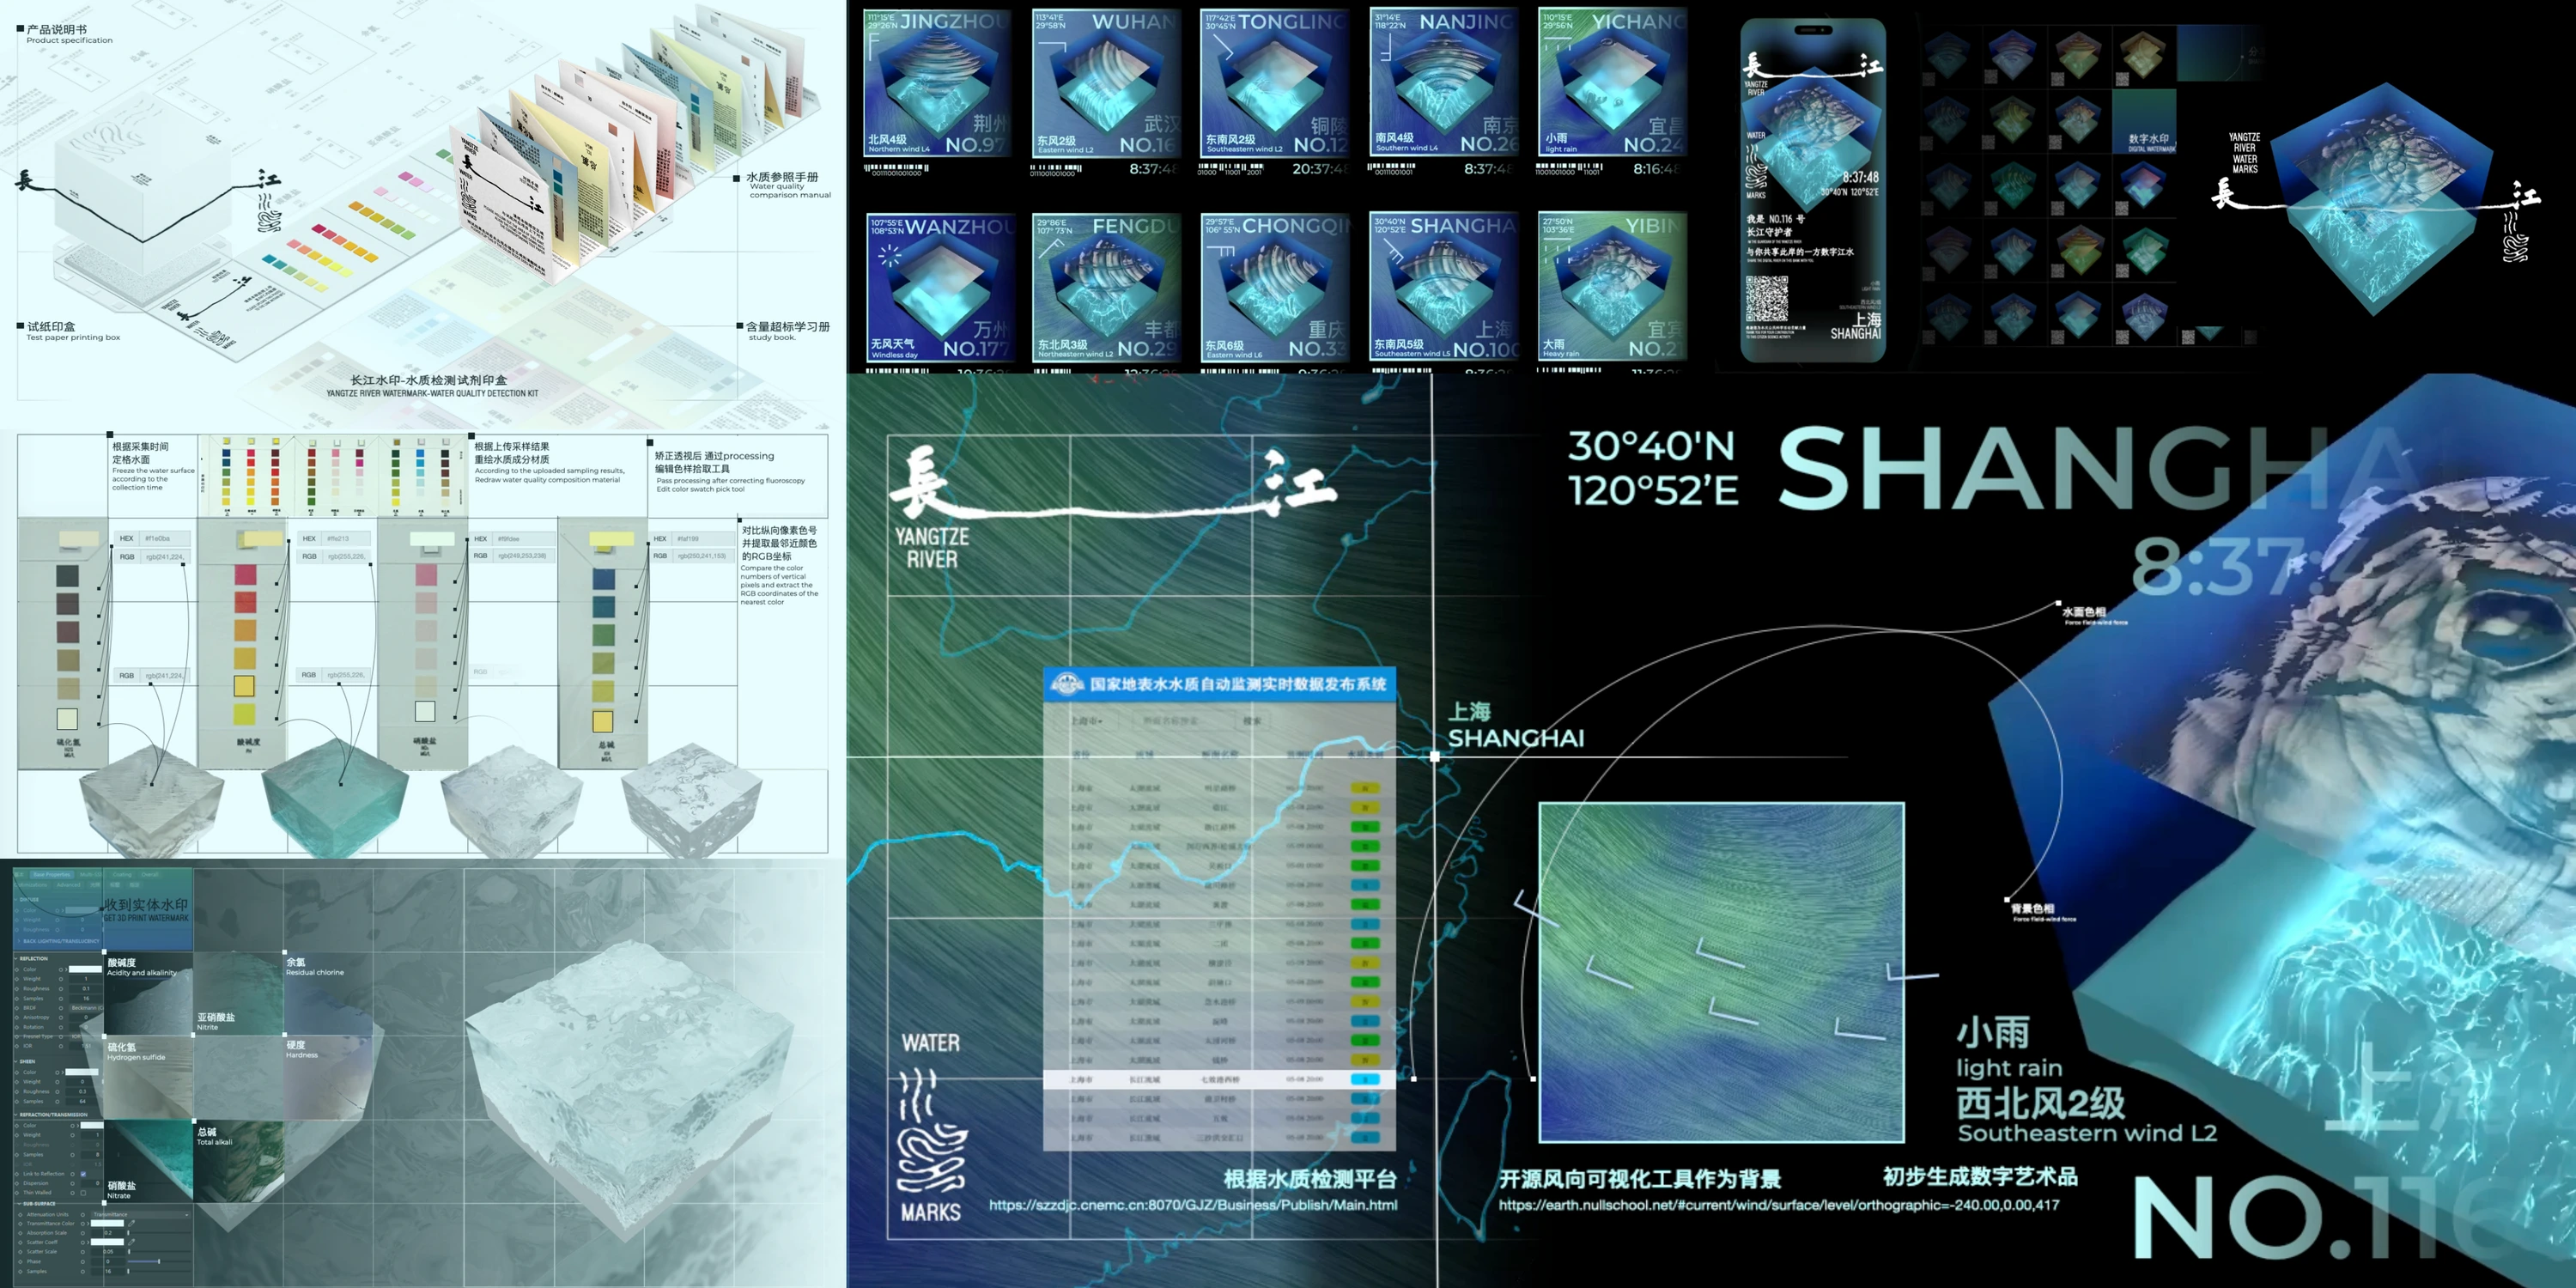
Yangtze Watermark
Yangtze Watermark is a participatory ecological science-communication project that brings together citizen-collected and real-time water-quality data from the Yangtze River. It uses data to create river sketches, translating them into digital artworks and a 3D-printed body of water.
02 / 2023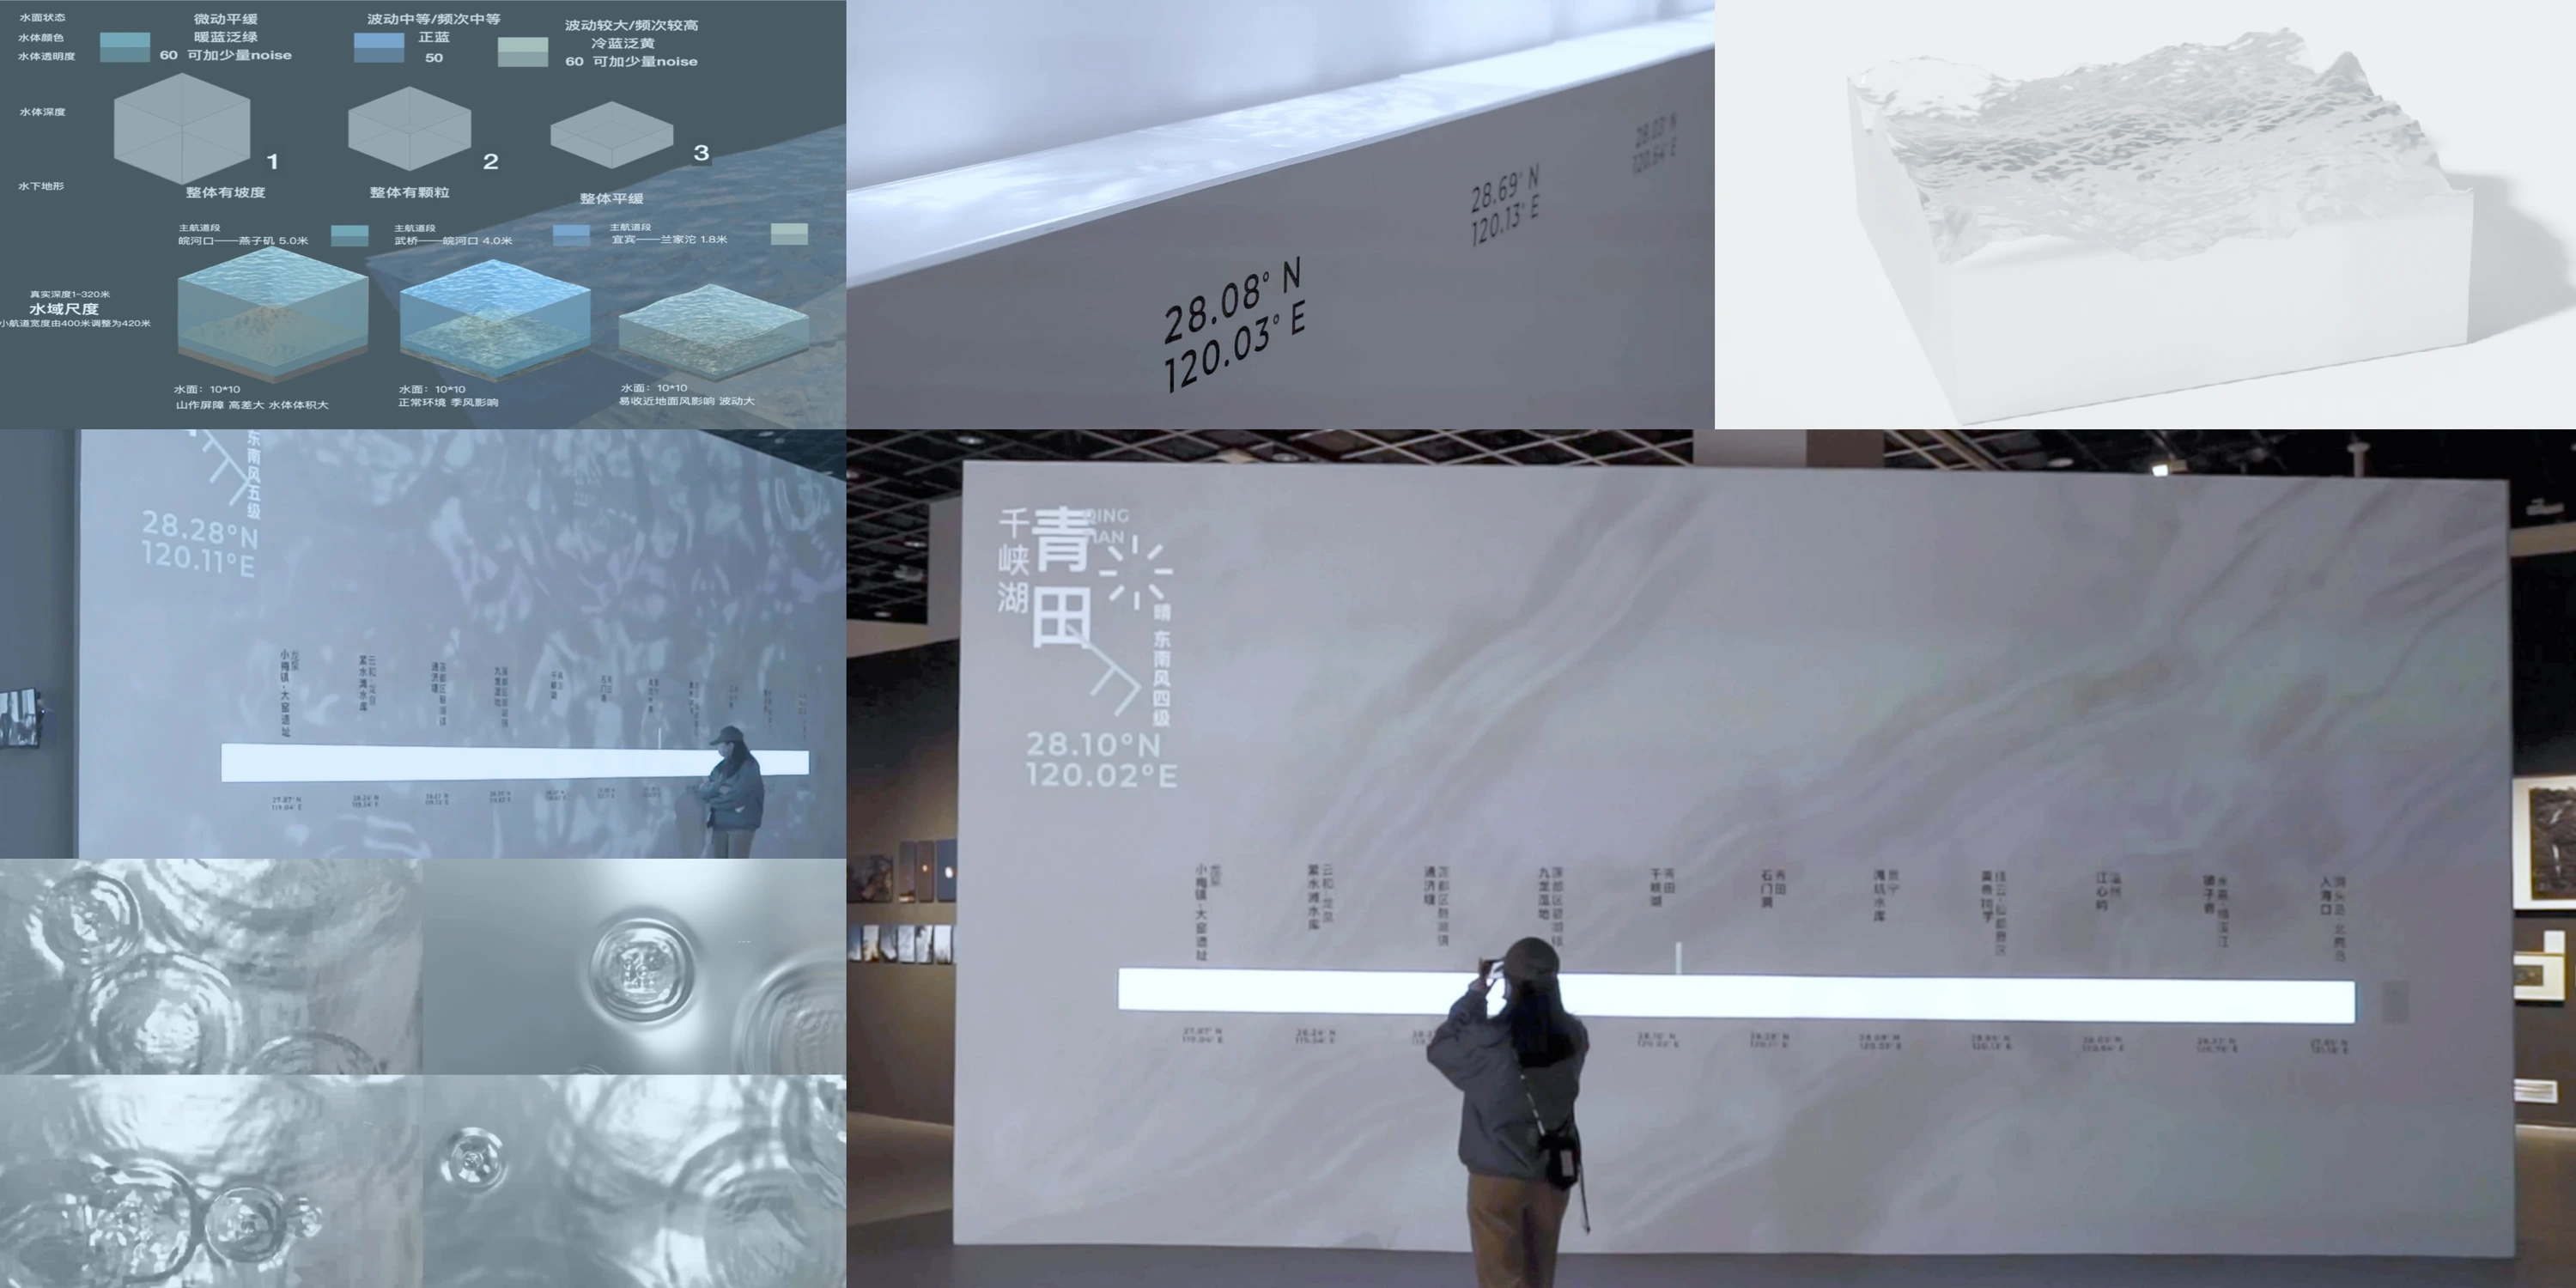
Ou River
Part of a series of digital hydrological maps, Ou River turns open weather and near-surface wind data from cities in the Ou River basin into an installation. Real-time water-surface simulations and 3D-printed water cubes give environmental data both digital and physical form.
03 / 2023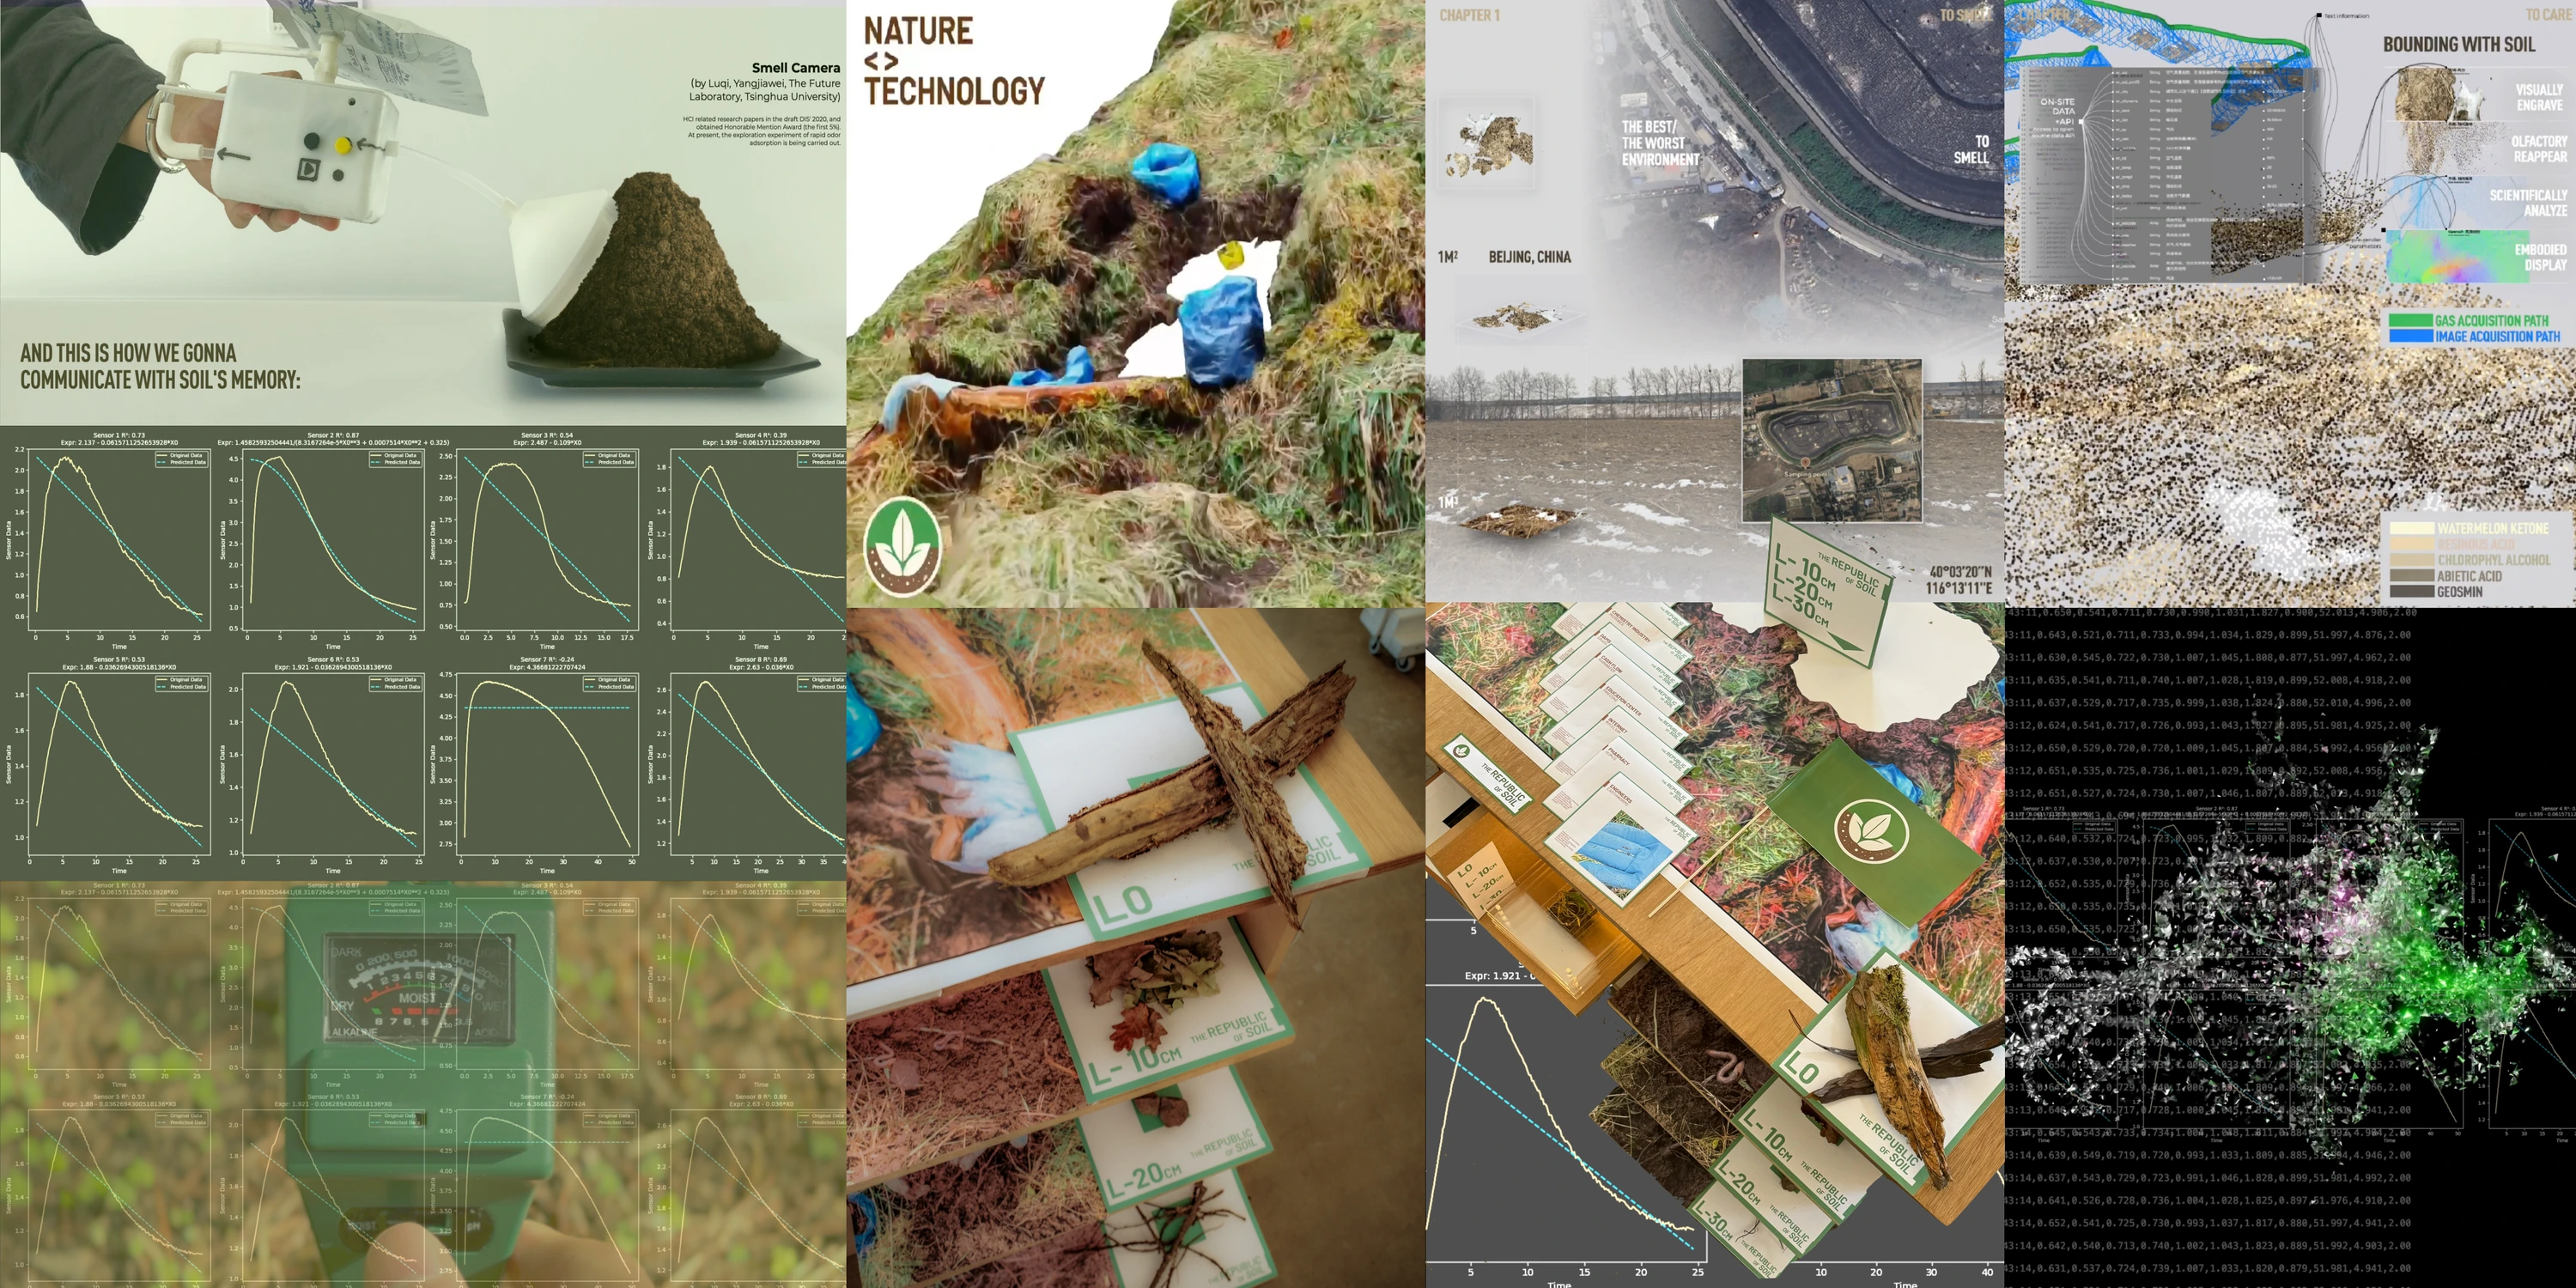
Soil, Breathing
Soil, Breathing explores the visualisation of smell across soil layers. Working with a team at the Glasgow School of Art’s School of Innovation & Technology, I investigated how an electronic nose and data on pH, moisture and light could make microbial activity in soil perceptible.
04 / 2023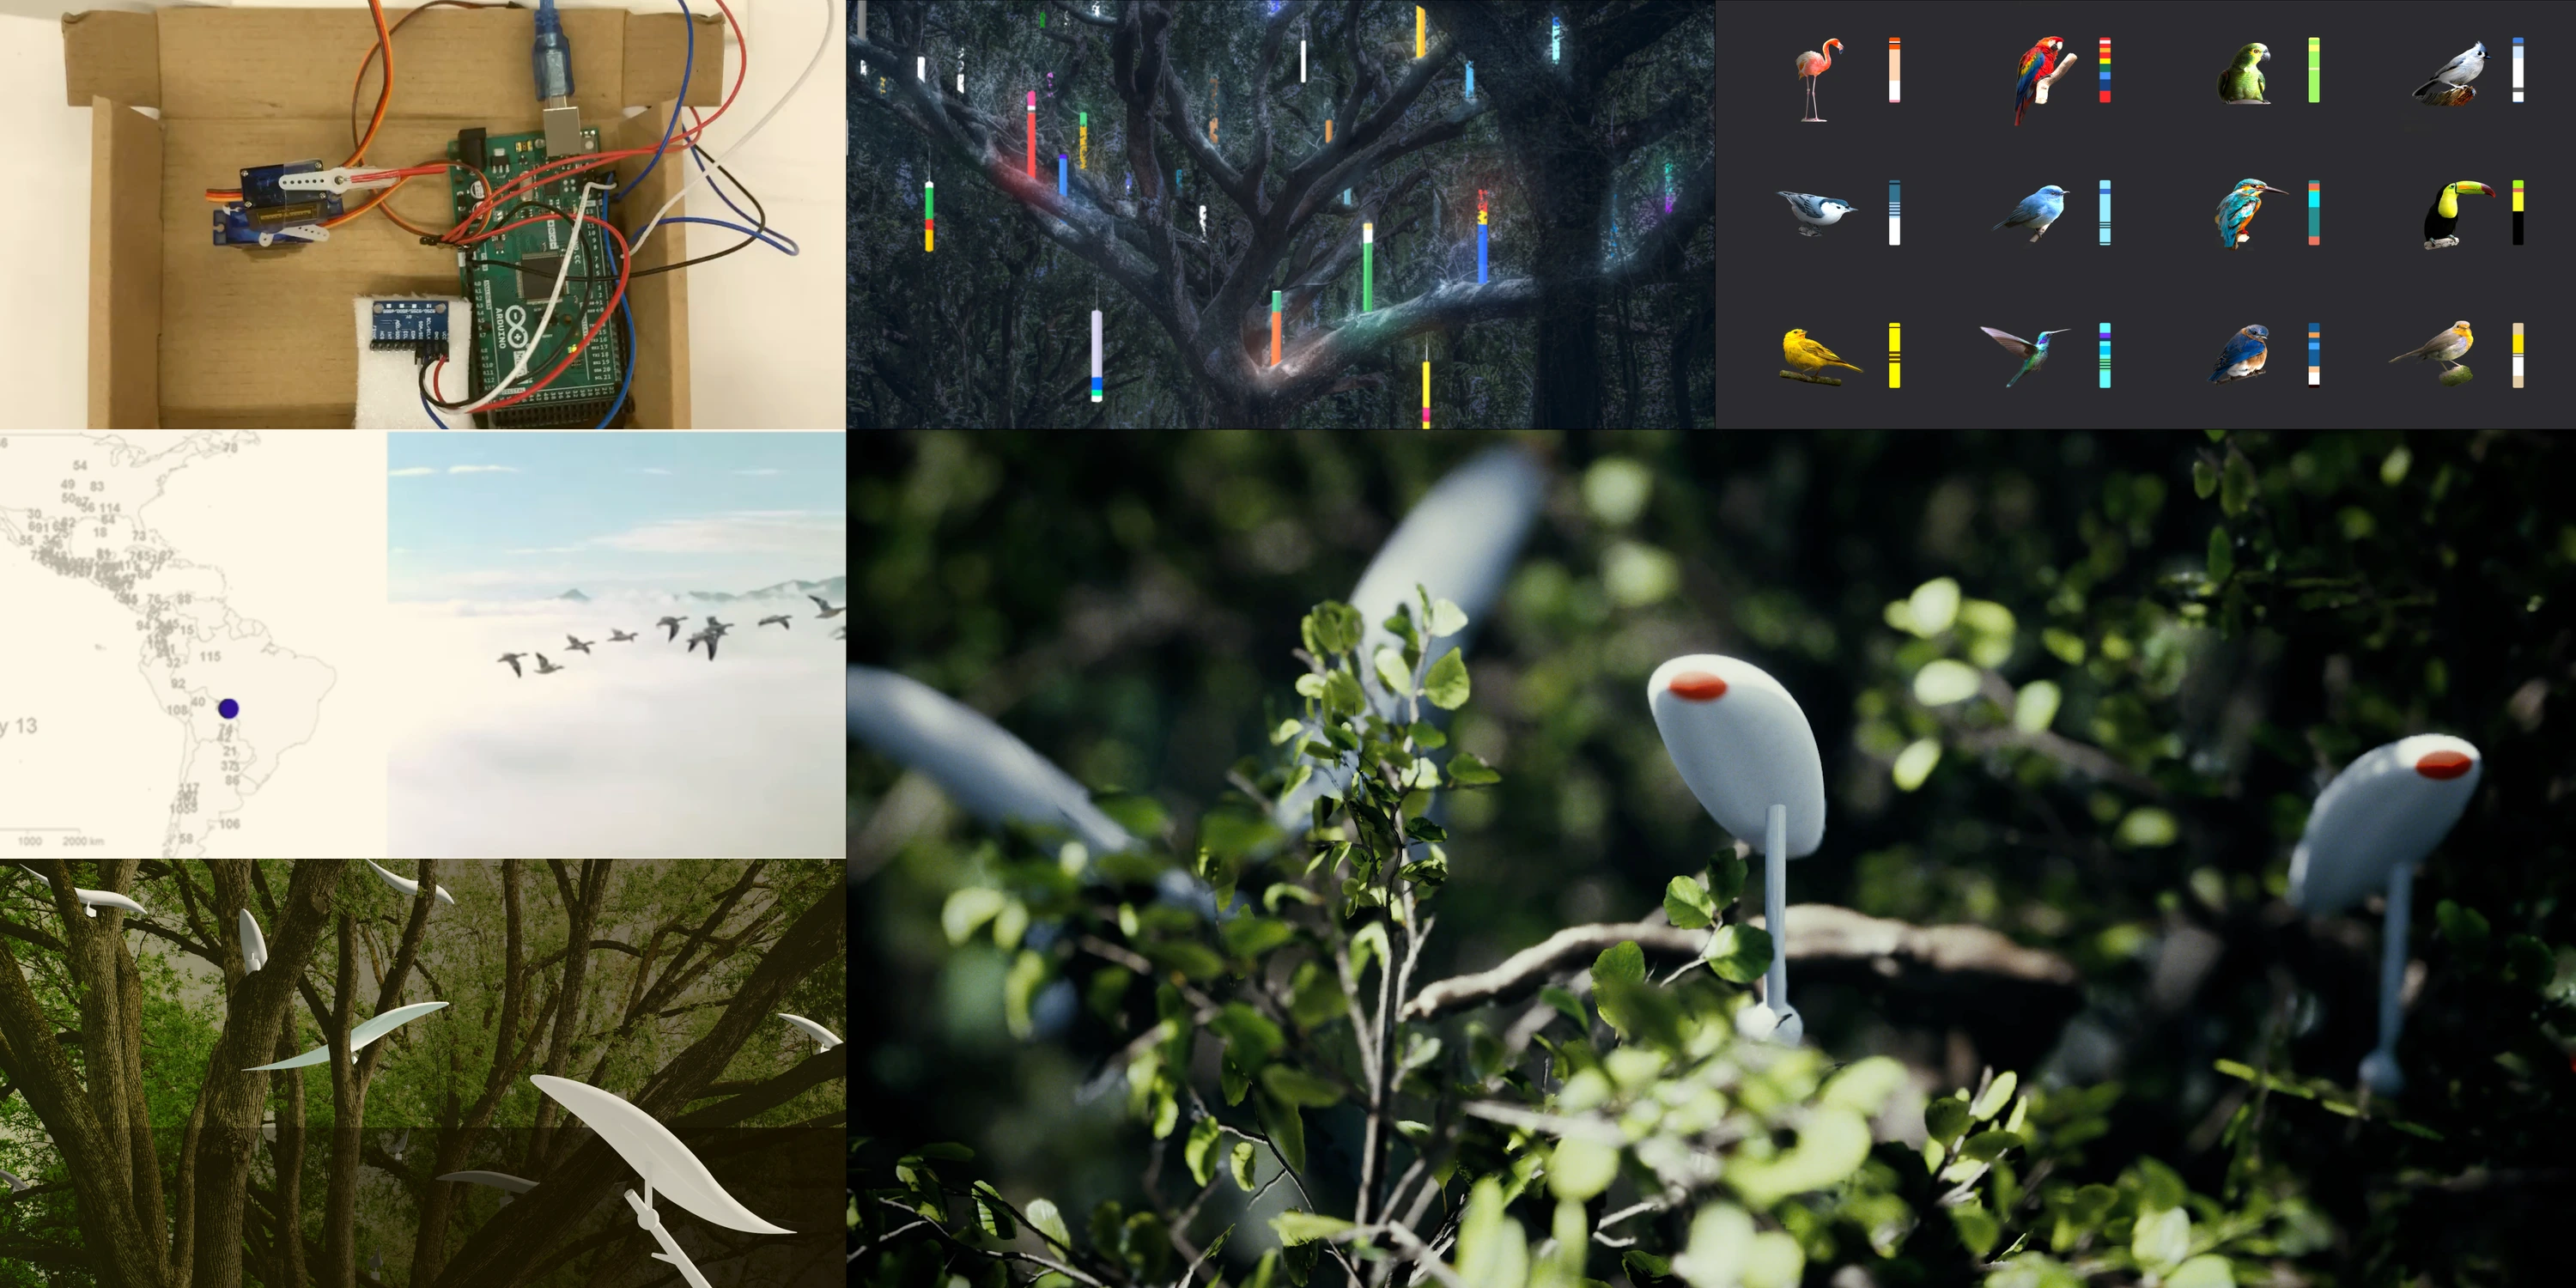
Forest of Birds
Forest of Birds is a public interactive installation driven by migration data for nearly 200 species of migratory birds. Developed with the Human–Field Interaction research team, it combines open data, hardware and software development, and sampled sound to create an ecological interaction experience.
05 / 2022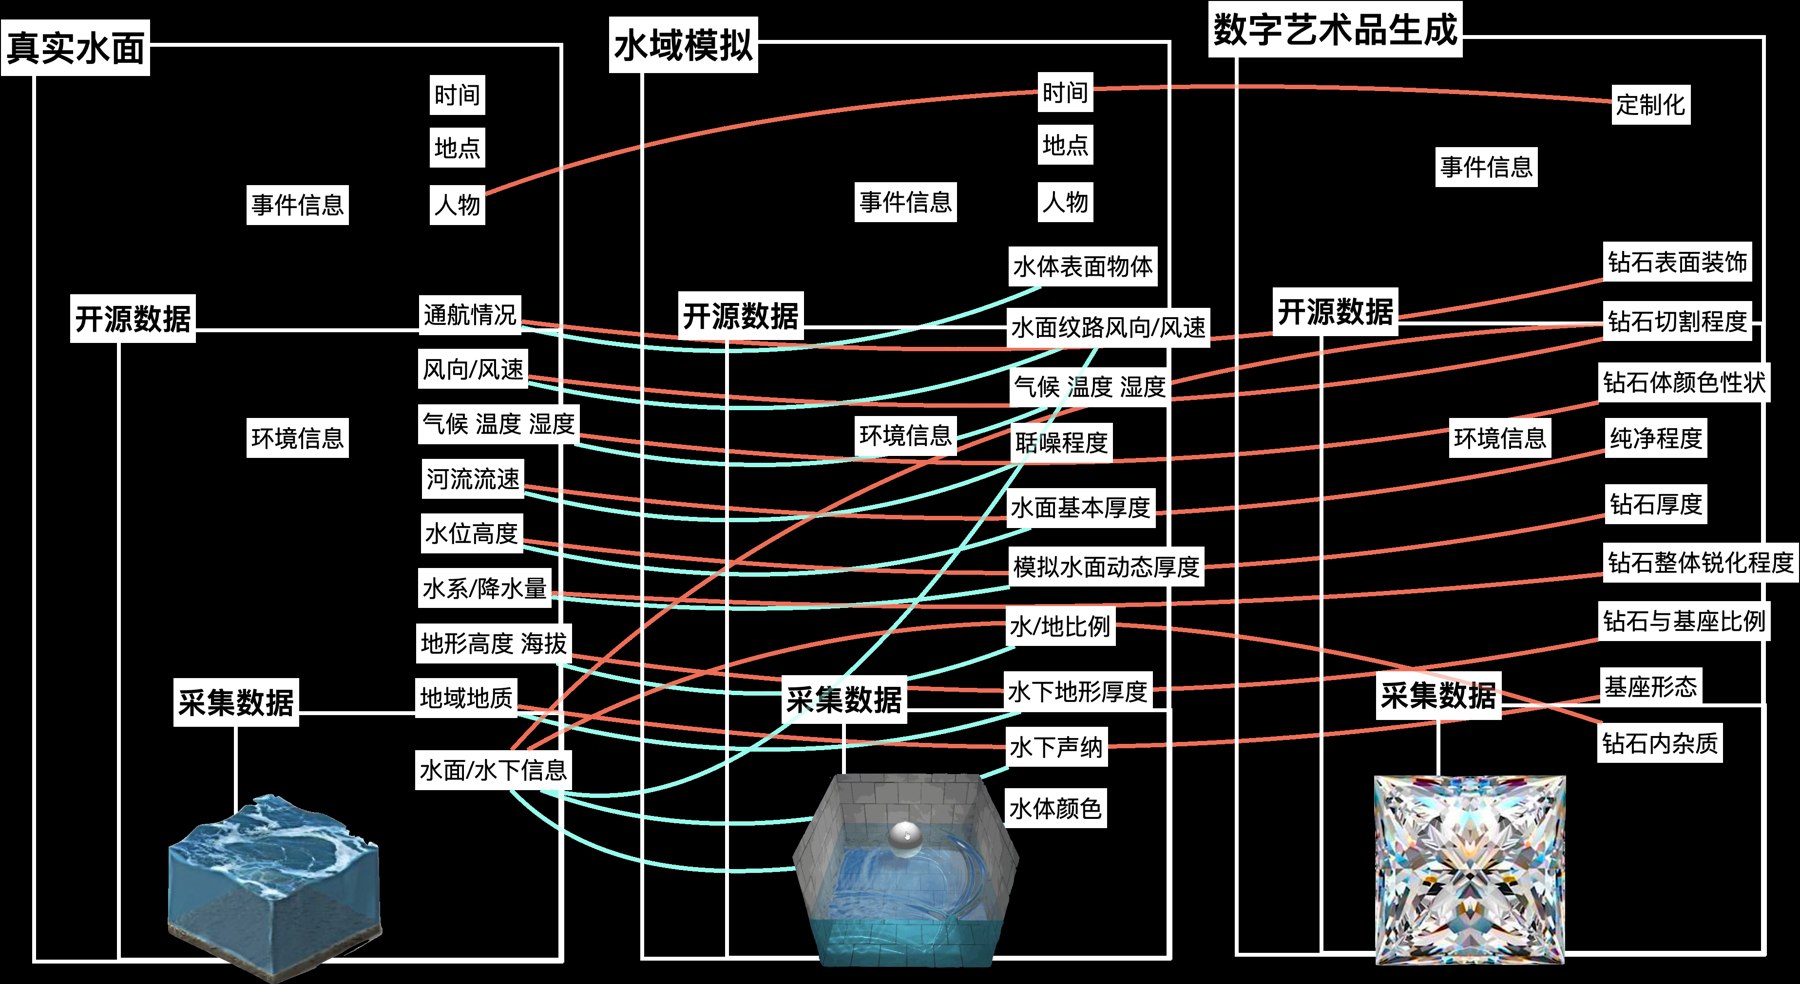
Remote Ecological Presence
Research into online communication and physical experiences of ecological data. Outputs include a final report and a third-authored paper on artistic expression of ecological data as an extension of perception, published in the 2022 Science & Art Symposium proceedings.
06 / 2026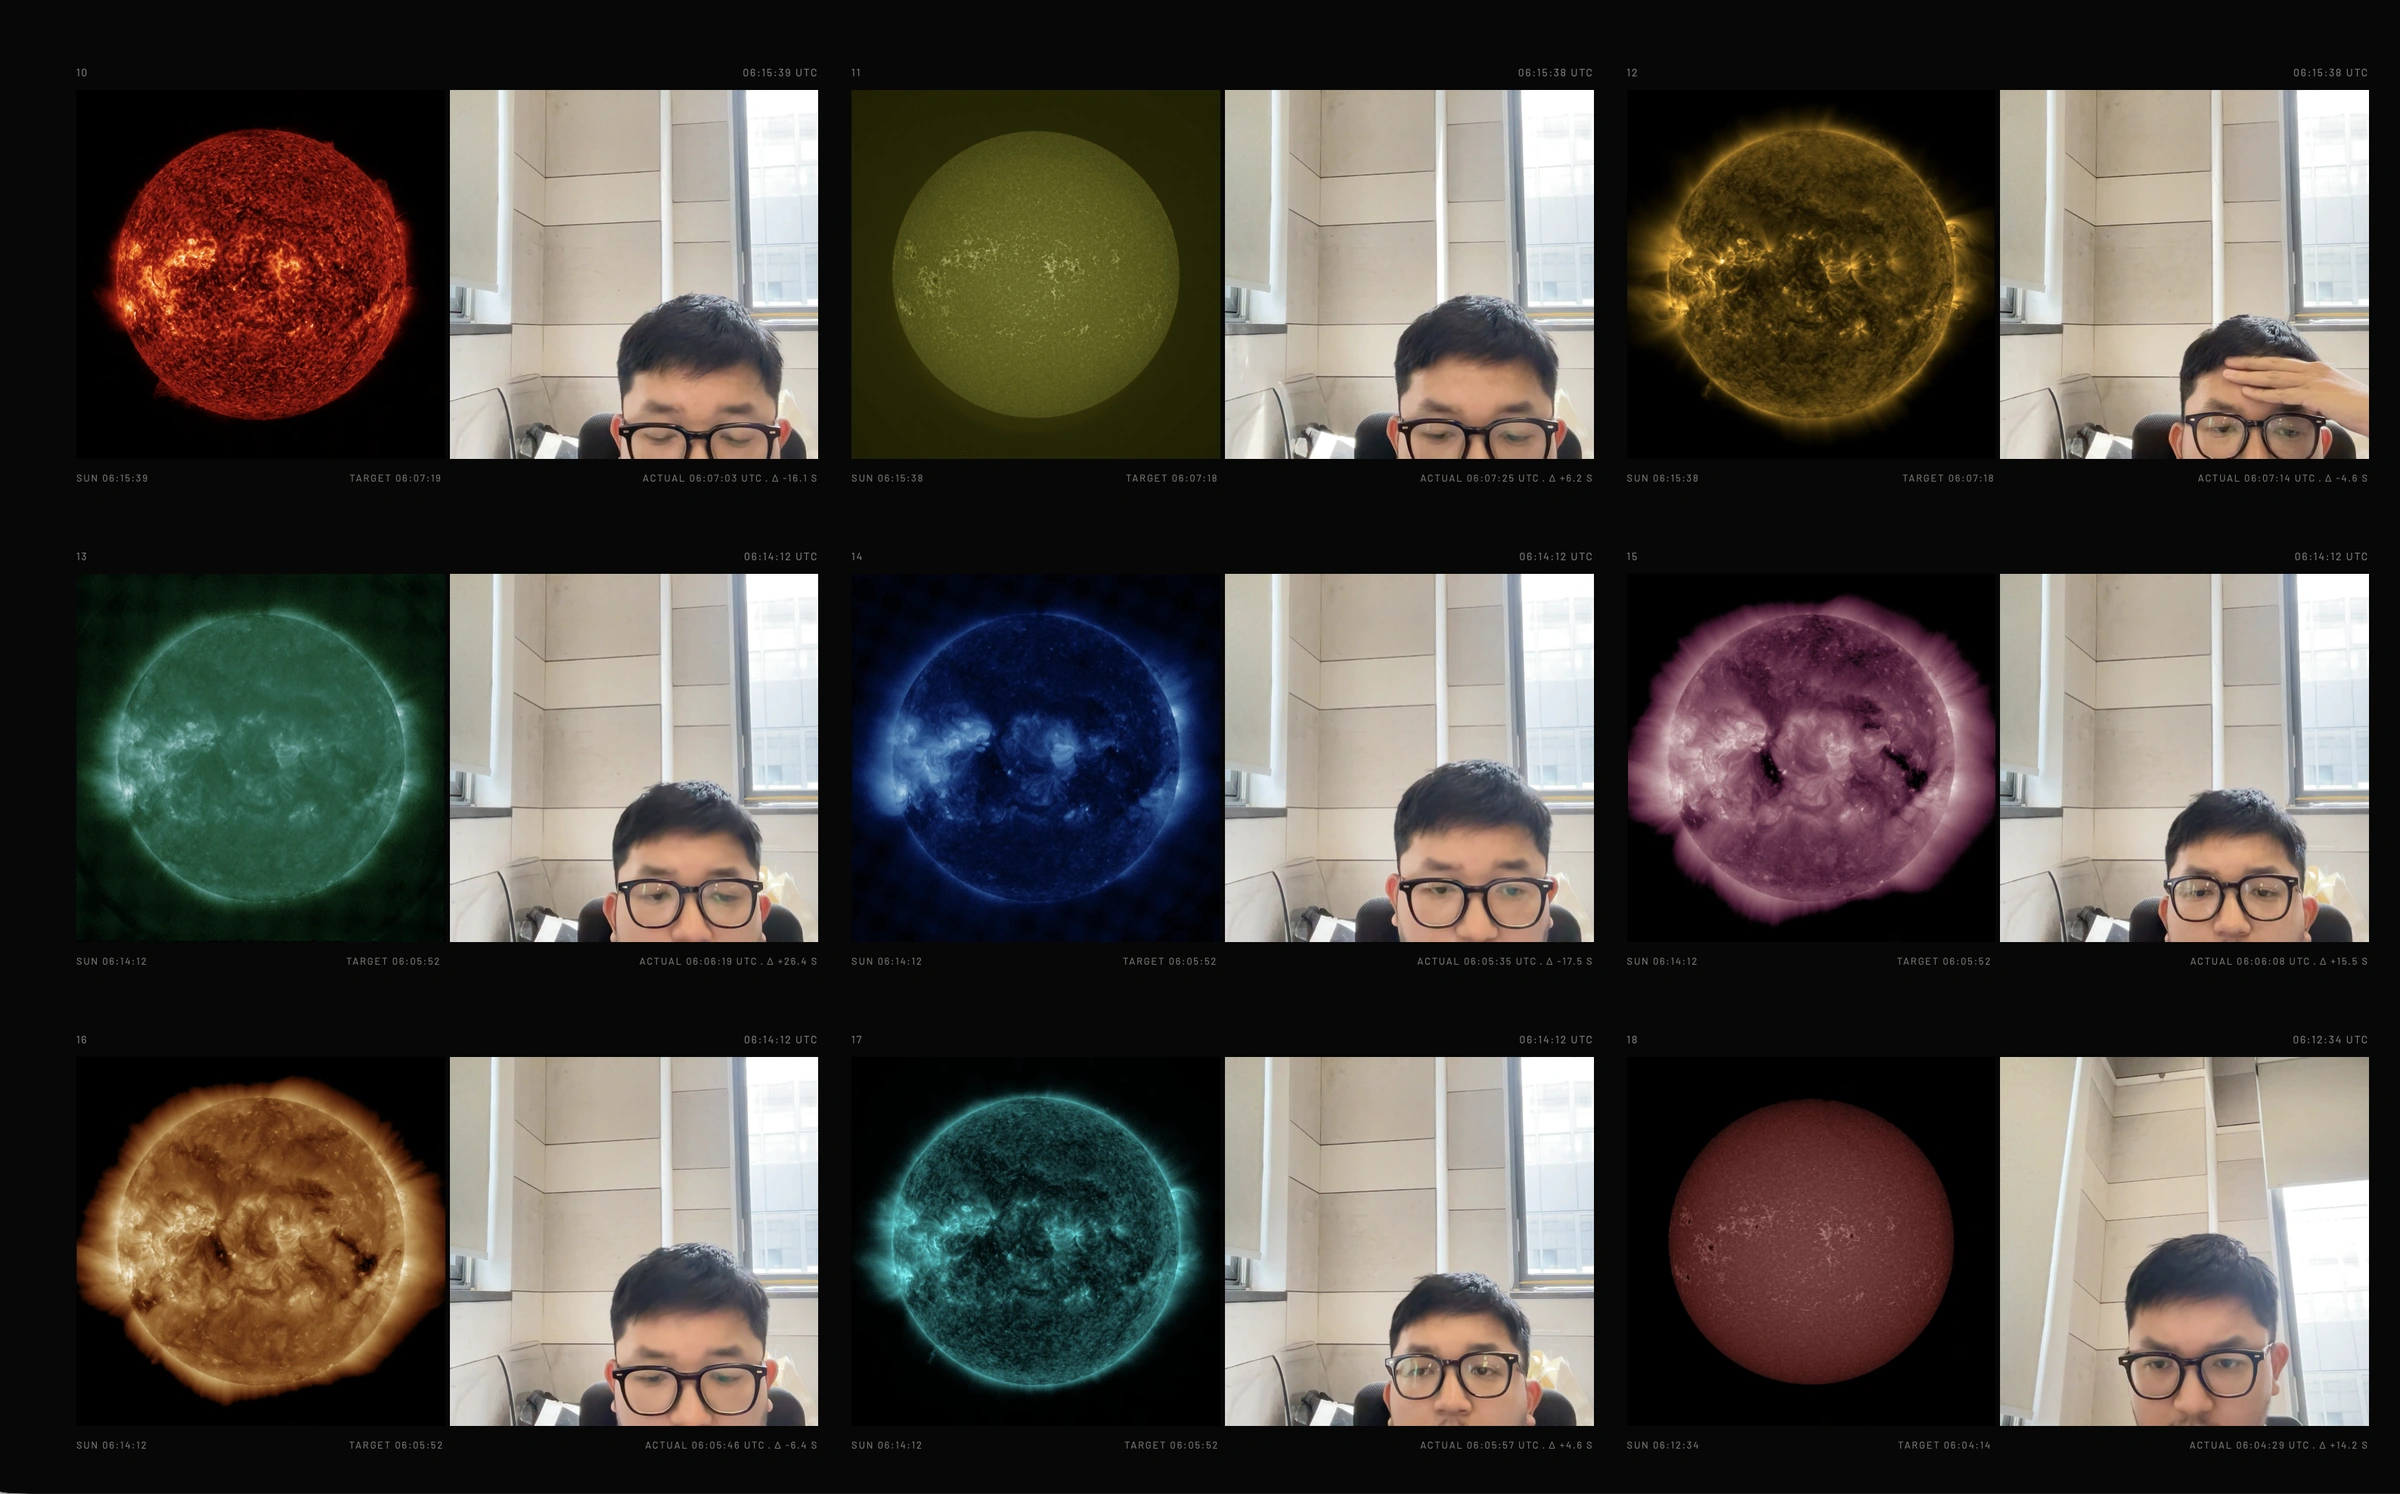
THE SUN, 8′20″ AGO
Sunlight takes approximately eight minutes and twenty seconds to reach Earth. The Sun we perceive now is always an image of its past. This work turns solar activity into a changing field of light and sound, allowing us to watch and listen to a distant star that has already changed by the time its light arrives.
07 / 2026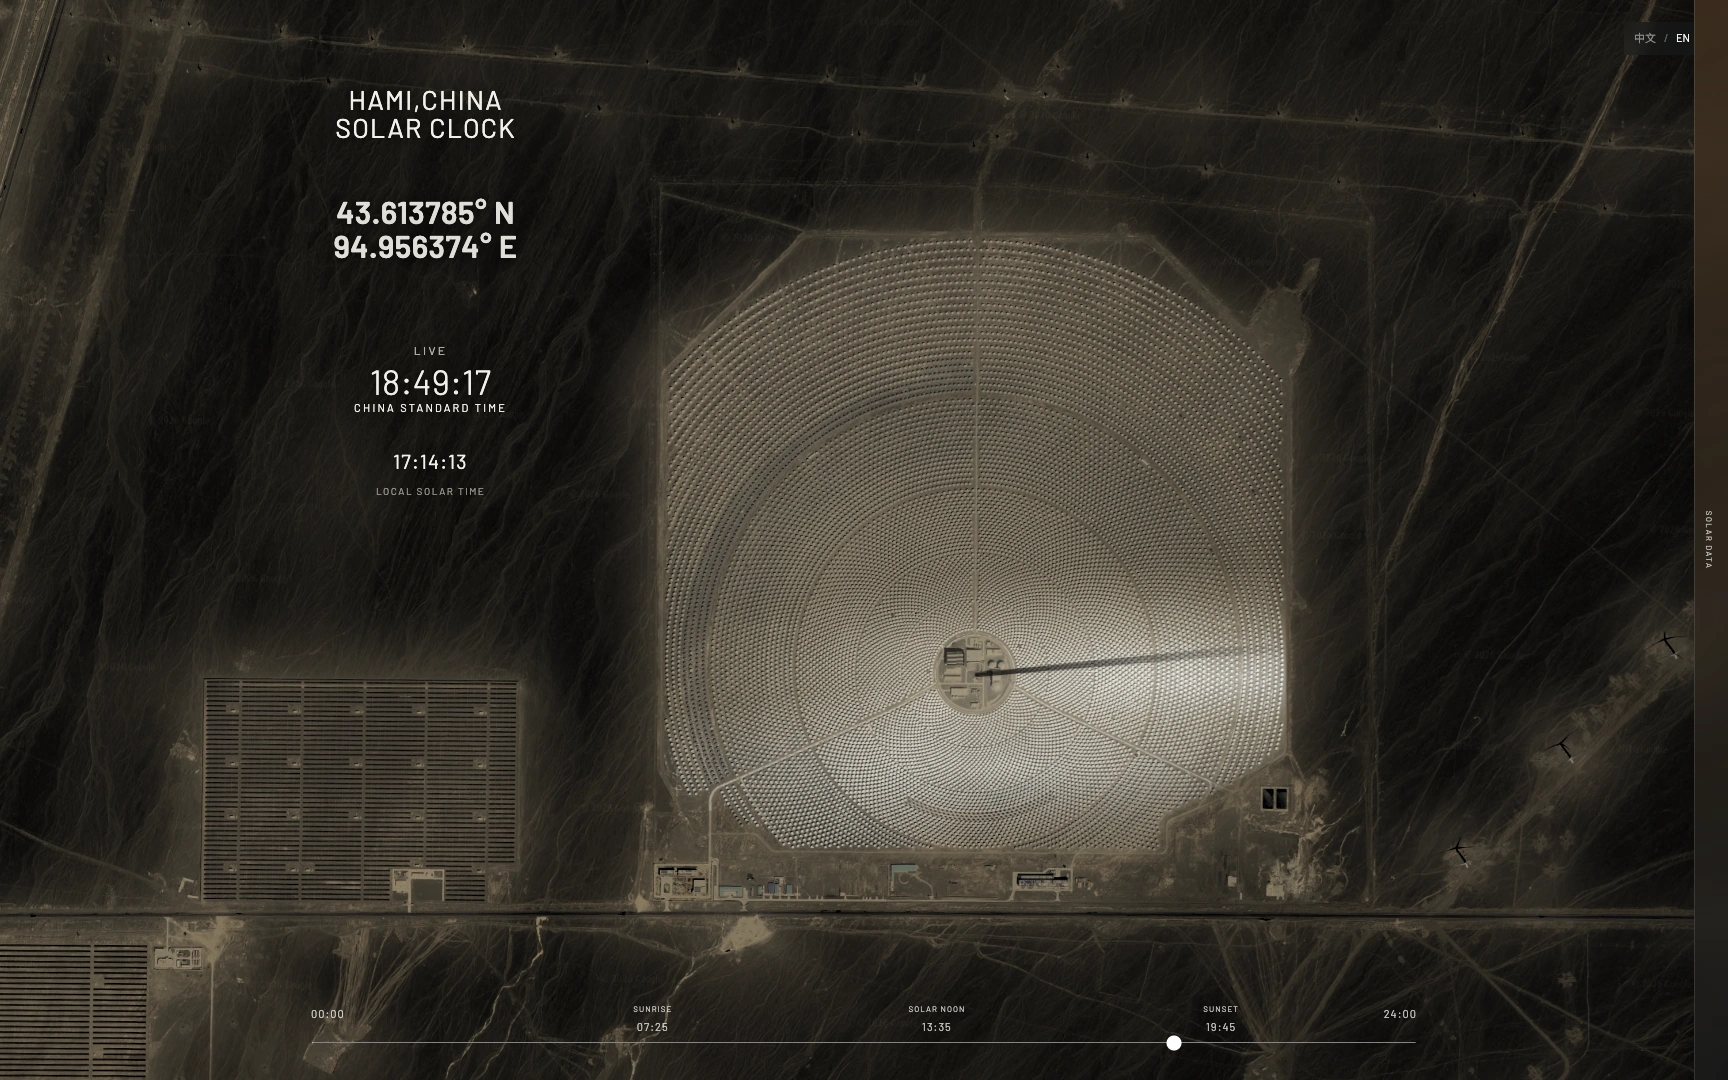
HAMI, CHINA SOLAR CLOCK
A real-time solar clock based on the Hami molten-salt tower power plant. The changing relationship between sunlight, the tower and its field of mirrors becomes a way to read the day, tracing solar energy from illumination to heat storage and electricity.
08 / 2026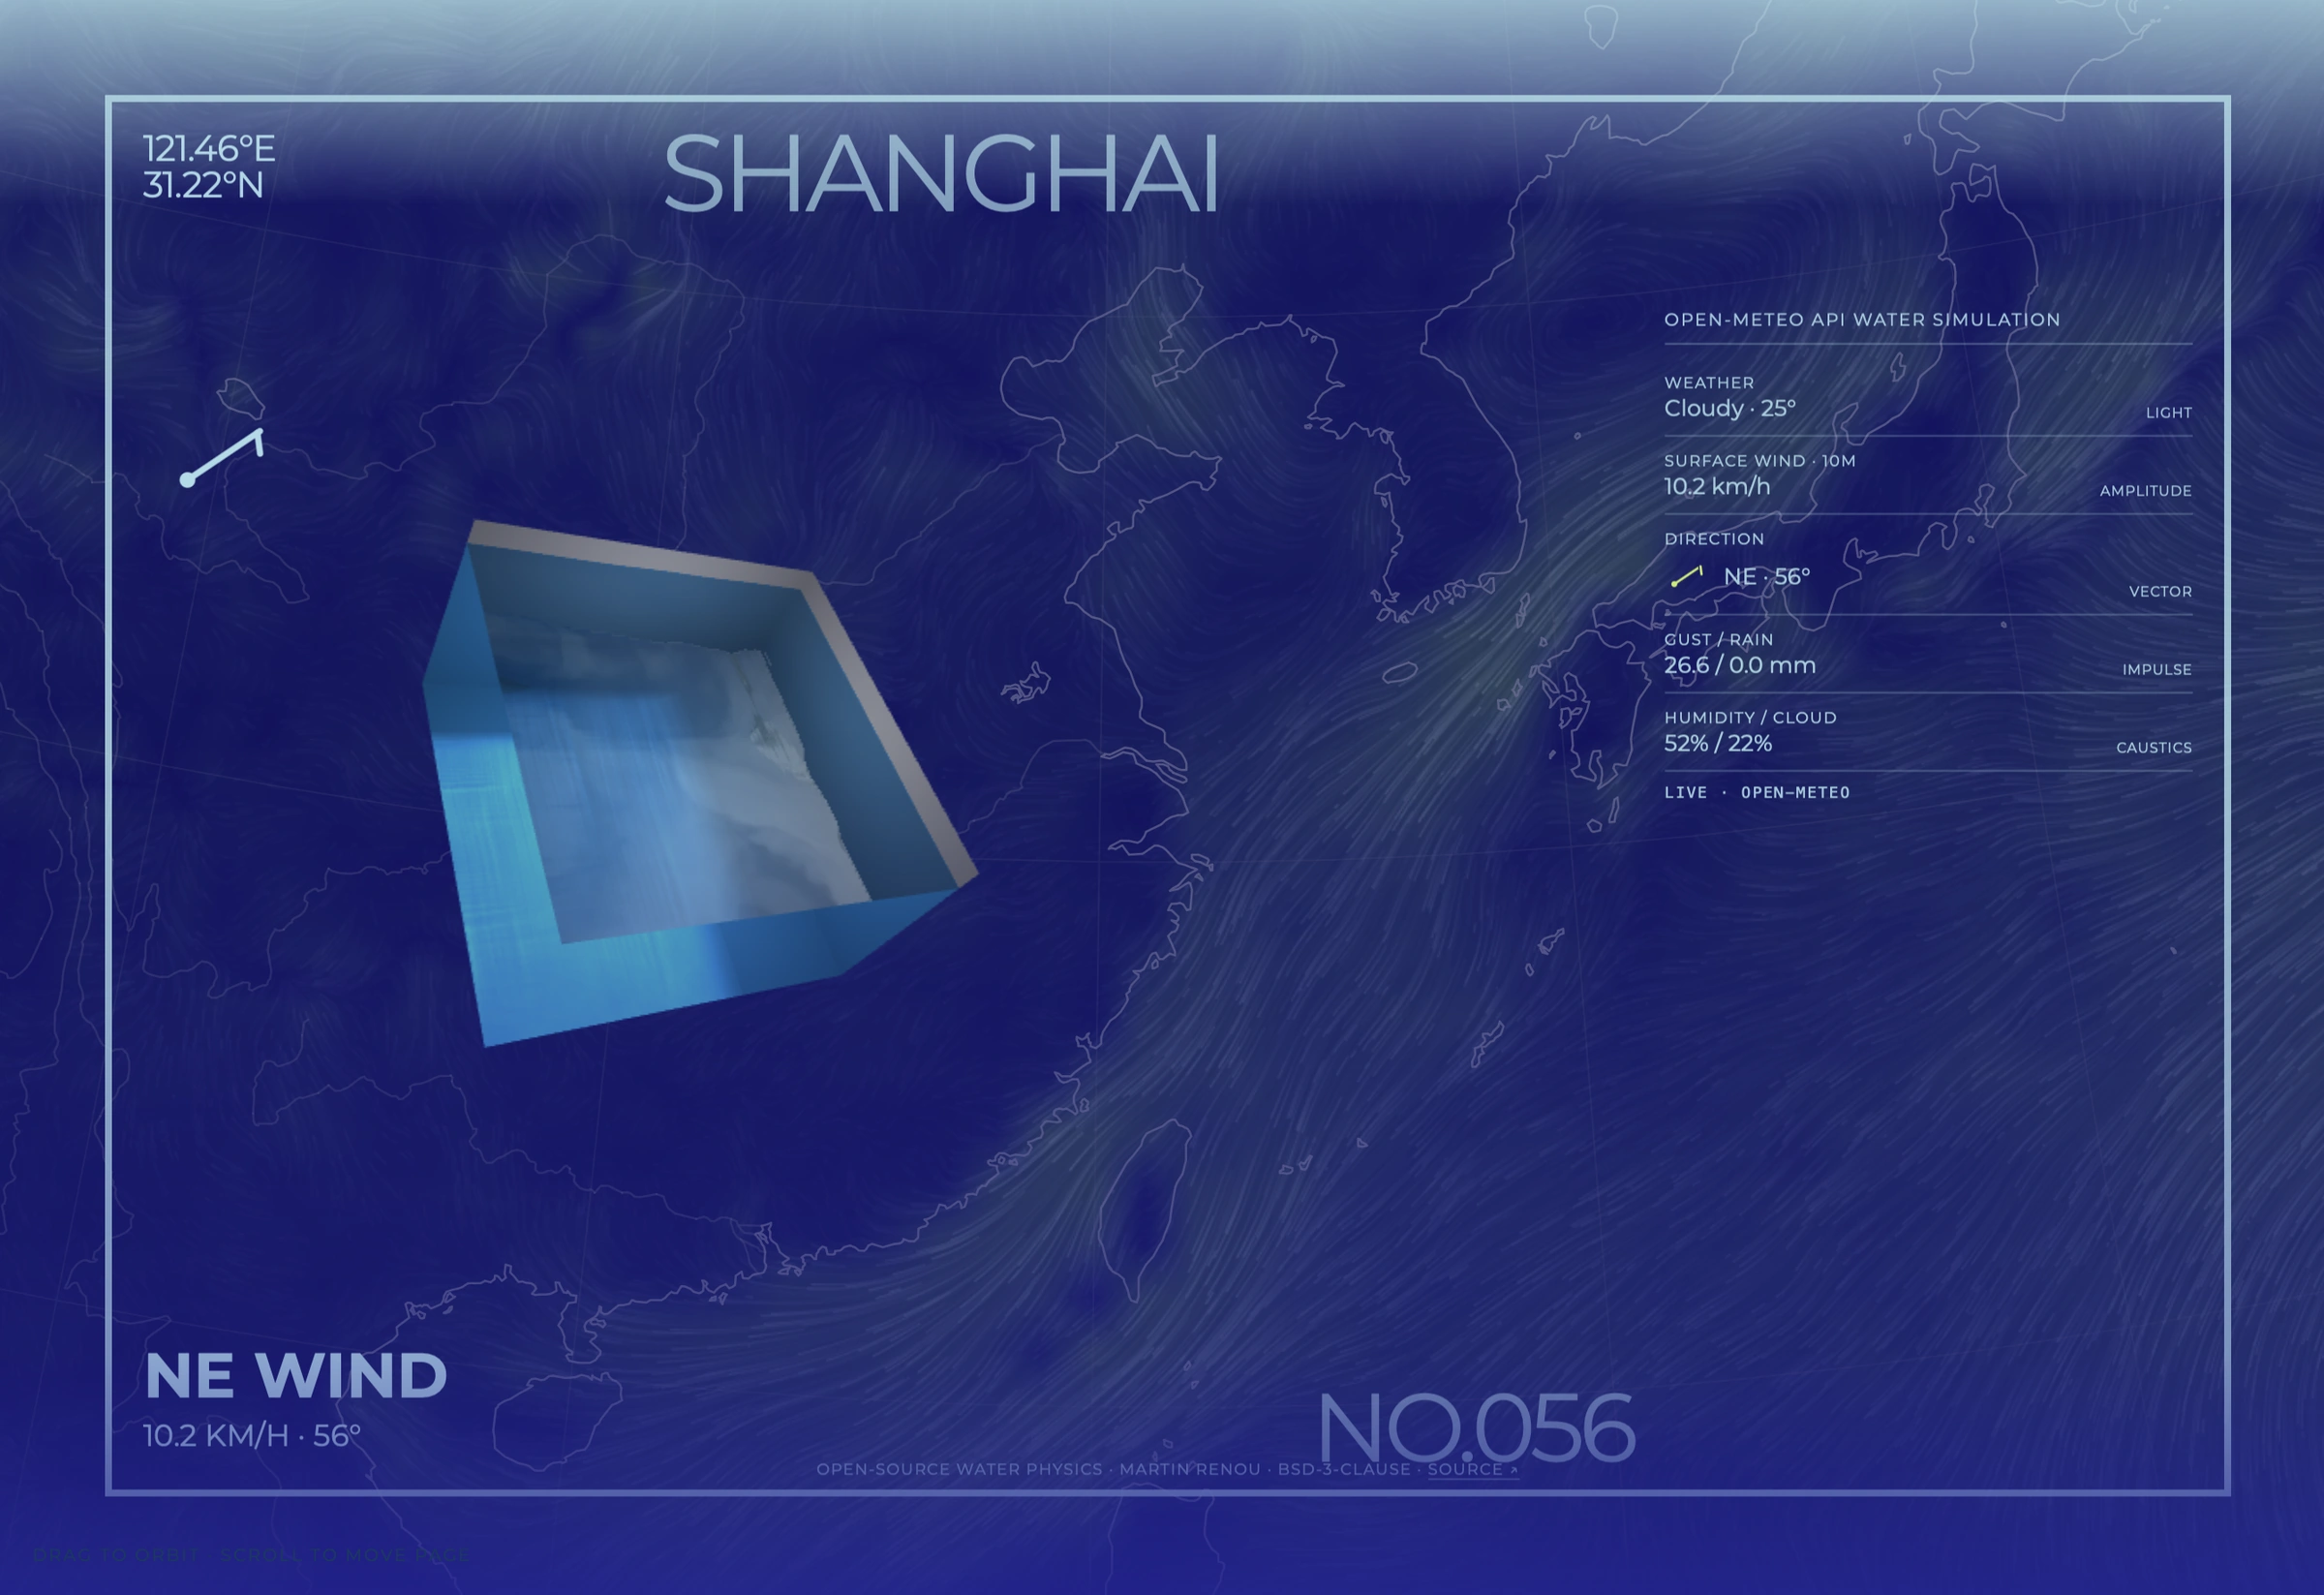
DATA-TRIGGERED WATER CUBE
Global atmospheric motion becomes the behavior of a small virtual body of water. By compressing planetary weather into a contained surface, the work gives invisible flows an immediate physical and visual presence.
09 / 2026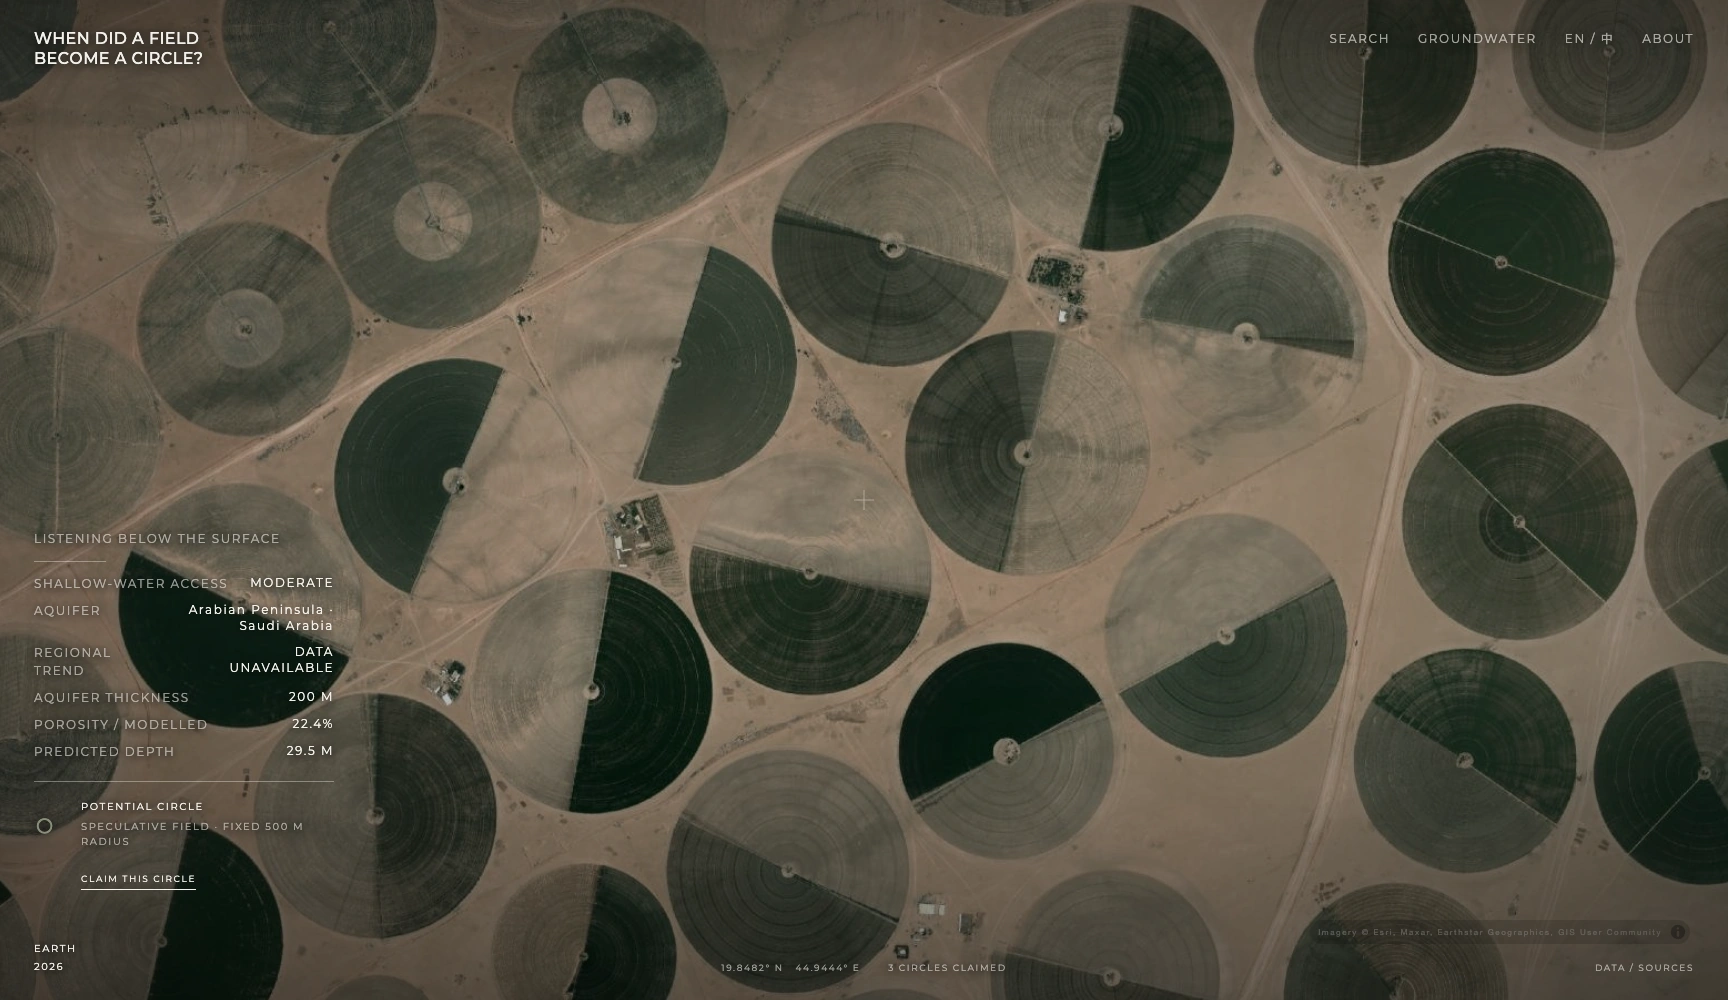
WHEN DID A FIELD BECOME A CIRCLE?
I begin with a question: when does a field become a circle—when a machine rotates, when crops grow, or when a satellite sees it? Through satellite imagery, groundwater models and environmental data, the work asks how an invisible resource becomes a visible geometry, and when watching becomes caring.